Cosmology View
My views on Cosmology and Physics
site navigation menu
Book by David Michalets
This is section 11 of 18.
The web page series for Distant Spectral Shifts is based on my book Cosmology Crisis Cleared.
NED identifies different redshift measurements.
11.1 Photometric Red Shift
Photometric redshift is a measurement which is not based on a shift of a specific absorption or emission line, obtained by analysis using spectroscopy.
Observation:
This method is inconsistent with the Doppler Effect cases described in the last section.
A photometric redshift is an estimate for the recession velocity of an astronomical object such as a galaxy or quasar, made without measuring its spectrum.
The technique uses photometry (that is, the brightness of the object viewed through various standard filters, each of which lets through a relatively broad passband of colours, such as red light, green light, or blue light) to determine the redshift, and hence, through Hubble's law, the distance, of the observed object.
The technique was developed in the 1960s, but was largely replaced in the 1970s and 1980s by spectroscopic redshifts, using spectroscopy to observe the frequency (or wavelength) of characteristic spectral lines, and measure the shift of these lines from their laboratory positions.
The photometric redshift technique has come back into mainstream use since 2000, as a result of large sky surveys conducted in the late 1990s and 2000s which have detected a large number of faint high-redshift objects, and telescope time limitations mean that only a small fraction of these can be observed by spectroscopy. Photometric redshifts were originally determined by calculating the expected observed data from a known emission spectrum at a range of redshifts. The technique relies upon the spectrum of radiation being emitted by the object having strong features that can be detected by the relatively crude filters.
As photometric filters are sensitive to a range of wavelengths, and the technique relies on making many assumptions about the nature of the spectrum at the light-source, errors for these sorts of measurements can range up to ?z = 0.5, and are much less reliable than spectroscopic determinations. In the absence of sufficient telescope time to determine a spectroscopic redshift for each object, the technique of photometric redshifts provides a method to determine an at least qualitative characterization of a redshift.
For example, if a Sun-like spectrum had a redshift of z = 1, it would be brightest in the infrared rather than at the yellow-green color associated with the peak of its blackbody spectrum, and the light intensity will be reduced in the filter by a factor of two (i.e. 1+z) (see K correction for more details on the photometric consequences of redshift). [Reference:
https://www.sdss.org/dr12/algorithms/photo-z/
https://en.wikipedia.org/wiki/Photometric_redshift
]
Observation:
The most important assumption when using this method is there are "strong features that can be detected by the relatively crude filters."
When there are no strong features, this method cannot provide a valid result.
Unfortunately, galaxy spectra being synchrotron radiation lack strong features. Because a star emits thermal radiation, its spectrum has a strong feaure.
The description mentions a "Sun-like spectrum" but that is not correct for a galaxy.
Perhaps, this method could work with stars. Their spectrum is from thermal radiation, so it has a "strong feature" because the wavelength having the highest intensity is associated with the light source temperature. The solar spectrum was provided in the section Stars.
When trying to apply this method to galaxies, the result might be like finding a pattern in noise.
11.2 Galaxy examples.
There are no readily available examples of specific galaxies and their spectra which passed through this specific processing. When lacking other's data, this book can provide real data to illustrate this exercise.
There are 2 spiral galaxy spectra in section Galaxy Types, with M31 and M33 but they used Cepheids for their distance.
There are also spectra of 17 galaxies in the section Cepheids.
None of these galaxies exhibit a "strong feature" to be affected by color filters as described.
The synchrotron radiation will exhibit no strong features like a star's spectrum can. Galaxies might have an emission line but whether it falls into a range of a filter could be random. An emission line comes from an atom and its motion, and is not valid for a massive galaxy.
11.3 Student Exercise
Someone from Rice University posted an Astronomy Laboratory exercise in 2014. A link is not included because the details of the specific exercise are not important. Its title is (if some wants to read it): [Reference:
Measuring the Redshift of M104 – The Sombrero Galaxy
http://drbobguy.freeshell.org/papers/astr230/project.pdf
Wikipedia offers a description of the galaxy.
https://en.wikipedia.org/wiki/Sombrero_Galaxy
The paperback did not state M104 is also NGC 4594.
]
Observation:
As an exercise, it might be purged and disappear from the internet eventually.
None of this description is about anything the student did. This is about the exercise and the analysis being done by software.
The student is given a spectrogram of M104 galaxy and the M104 measurements:
M104 z = 0.00342 and its velocity = 1024 km/sec.
The M104 spectrogram shows wavelengths from about 3900 Angstroms to 7200.
The student apparently has access to software which can identify lines from Mercury and Neon.
The software apparently calculates the z and velocity for these lines.
The software used these metallic lines to calculate a velocity which was off from expected for M104 by 68%.
The student is not learning where the M104 velocity came from.
Among the many mistakes the student might not recognize:
1) The spectrogram does not present the origin of the stated velocity.
2) Mercury and neon lines are always irrelevant to a galaxy. They are atoms in the line of sight and any measured motion is irrelevant. If the results had been closer than off by 68%, the results are still meaningless.
The inappropriate spectrogram cannot reveal the spectrum an astronomer must have used for the M104 value, which is identified below after checking the set of 25.
I did an exercise a student might have to do, finding the origin of the accepted velocity of M104.
The PDF has references, including NED.
The following are the spectra in NED for M104. There are 25 in the set. The origin of the M104 velocity is not in the spectrogram given to the student.
The NED spectra at the time of writing this did not include the spectra in the exercise, despite 25 in the set.
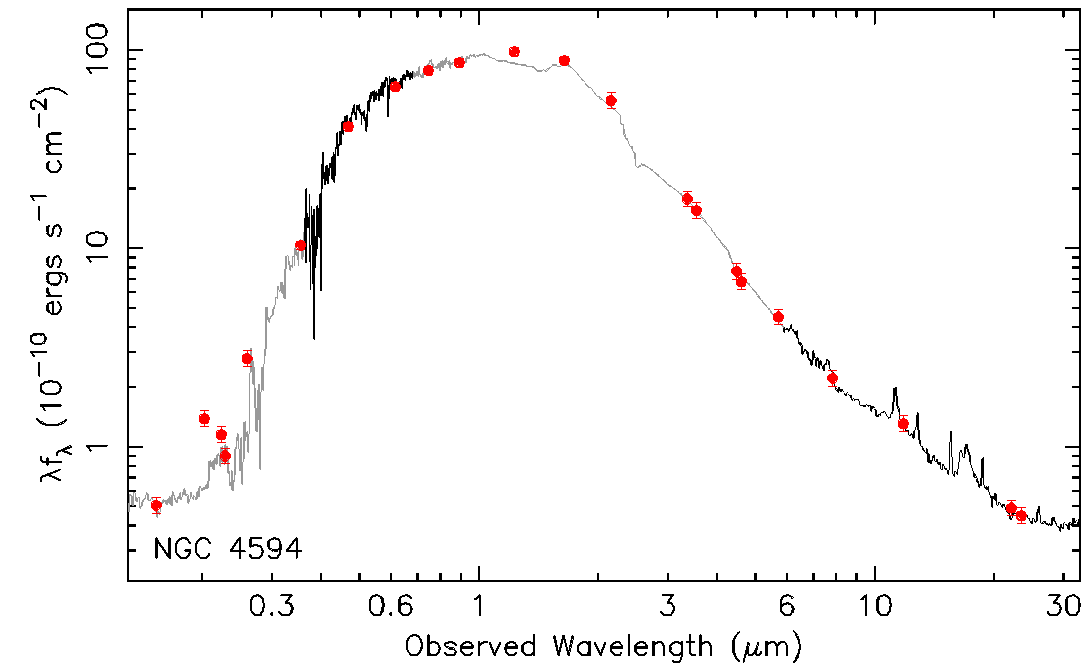
Image 1, from the integration of multiple telescopes, in the UV-Mid-IR band.
https://www.cosmologyview.com/NEDcap/M104-spectra/NED-M104-1-integrated.png
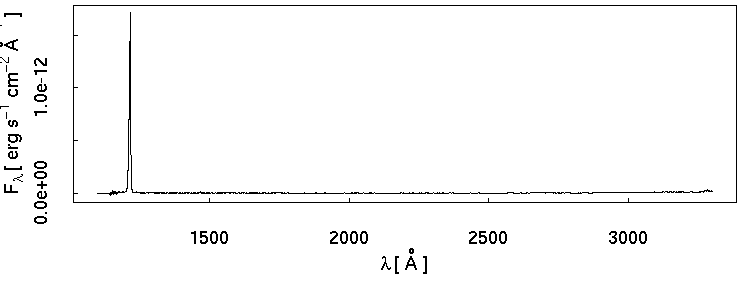
Image 2 is the UV band from the Nucleus Region.
https://www.cosmologyview.com/NEDcap/M104-spectra/NED-M104-2-UV.png
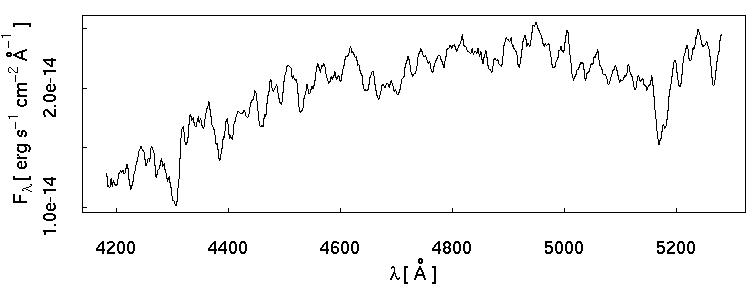
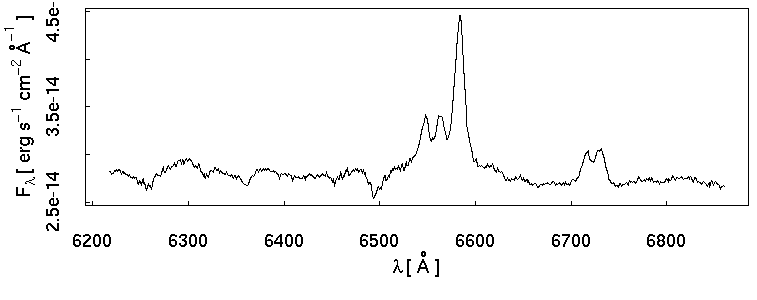
Image 3 is the Optical band from the Nucleus Region.
https://www.cosmologyview.com/NEDcap/M104-spectra/NED-M104-3-OPT.png
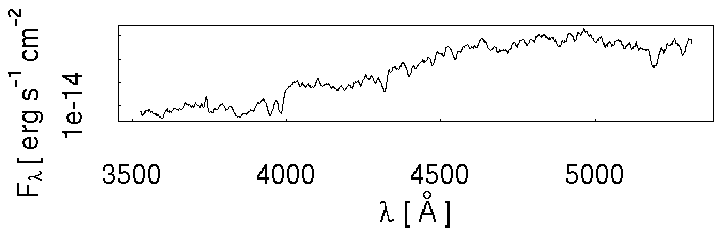
Image 4 is the Optical band from the Nucleus Region.
https://www.cosmologyview.com/NEDcap/M104-spectra/NED-M104-4-OPT.png
Image 5 is the Optical band from the Nucleus Region.
https://www.cosmologyview.com/NEDcap/M104-spectra/NED-M104-5-OPT.png
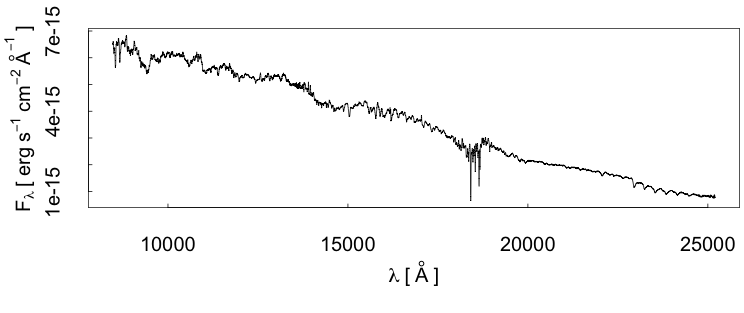
Image 6 is the Near-IR band from the Nucleus Region.
https://www.cosmologyview.com/NEDcap/M104-spectra/NED-M104-6-NIR.png
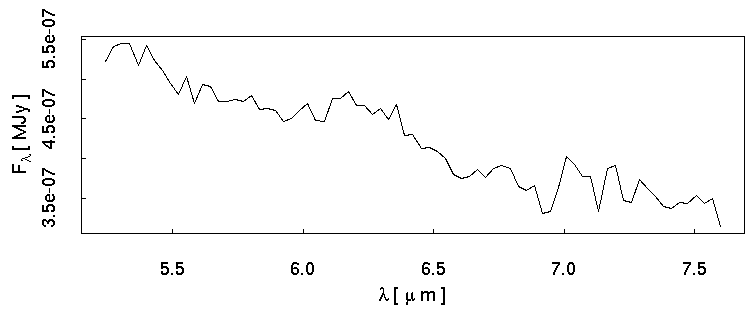
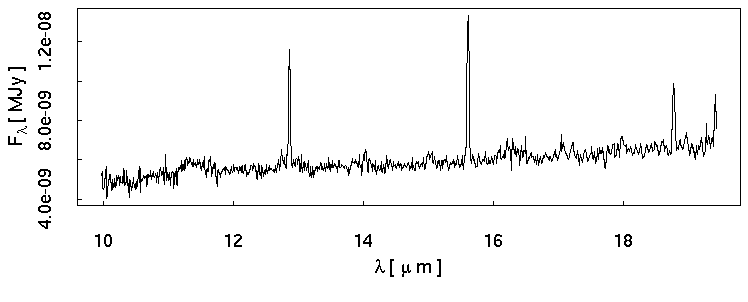
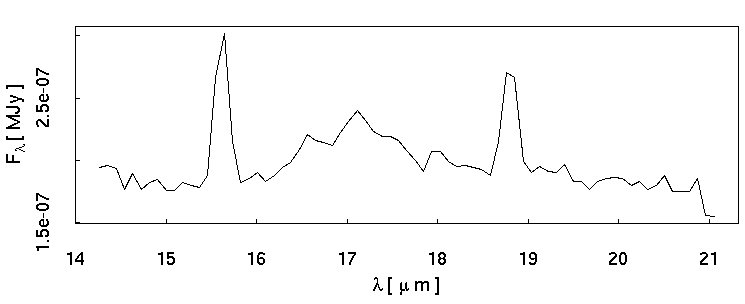
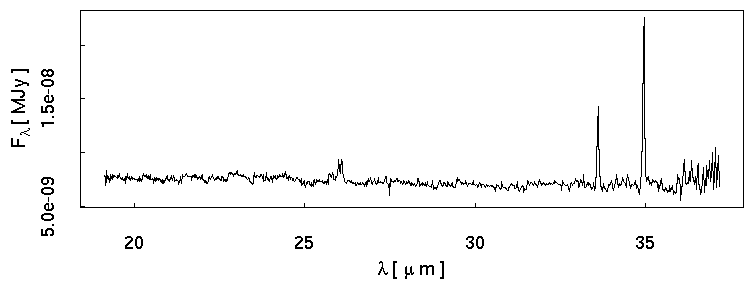
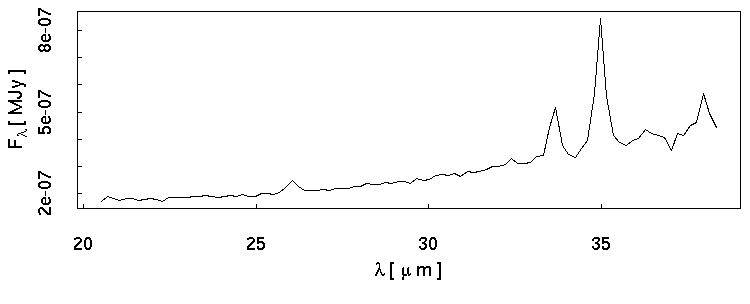
Image 7 is the Mid-IR band from the Nucleus Region.
https://www.cosmologyview.com/NEDcap/M104-spectra/NED-M104-7-MIR.png
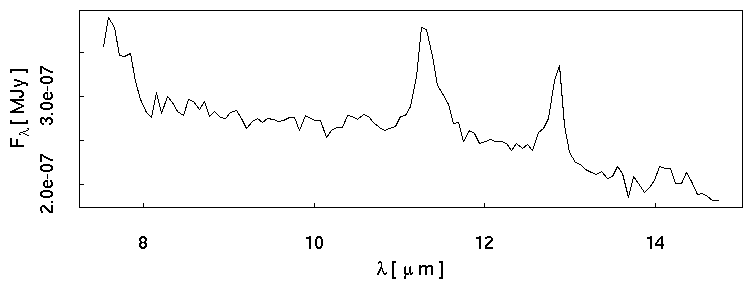
Image 8 is the Mid-IR band from the Nucleus Region.
https://www.cosmologyview.com/NEDcap/M104-spectra/NED-M104-8-MIR.png
Image 9 is the Mid-IR band from the Nucleus Region.
https://www.cosmologyview.com/NEDcap/M104-spectra/NED-M104-9-MIR.png
Image 10 is the Mid-IR band from the Nucleus Region.
https://www.cosmologyview.com/NEDcap/M104-spectra/NED-M104-10-MIR.png
Image 11 is the Mid-IR band from the Nucleus Region.
https://www.cosmologyview.com/NEDcap/M104-spectra/NED-M104-11-MIR.png
Image 12 is the Mid-IR band from the Nucleus Region.
https://www.cosmologyview.com/NEDcap/M104-spectra/NED-M104-12-MIR.png
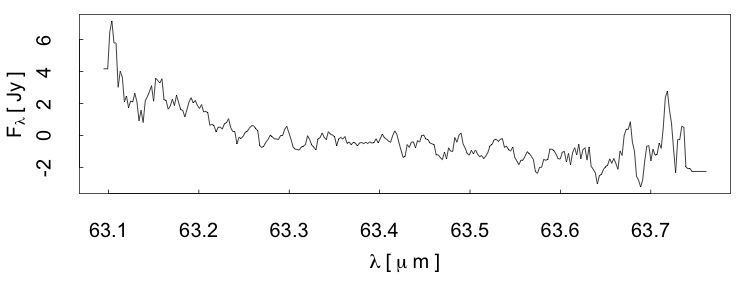
Image 13 is the [OI] 63um line from the Nucleus Region.
https://www.cosmologyview.com/NEDcap/M104-spectra/NED-M104-13-OI.png
Images 14 and 15 are also O I.
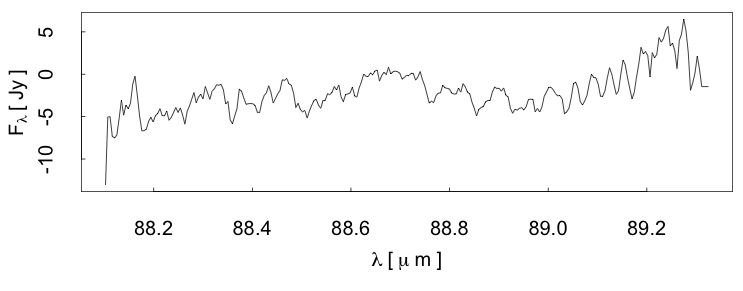
Images 16 and 17 are [OIII] 88um line from the Nucleus Region.
https://www.cosmologyview.com/NEDcap/M104-spectra/NED-M104-16-OII.png
Images 18, 19, 20, 21 are [NII] 122um line from the Nucleus Region.
Images 22, 23, 24 are [CII] 158um line from the Nucleus Region.
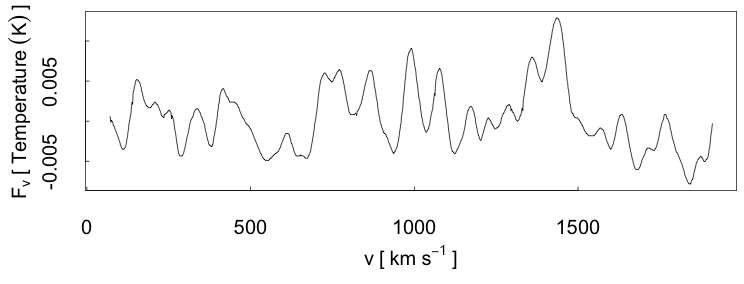
Image 25 is H I from Integrated Region.
https://www.cosmologyview.com/NEDcap/M104-spectra/NED-M104-25-HI.png
Observations:
Image 1)
The long wavelengths in this infrared band offer nothing of interest here.
Image 2)
Lyman-alpha emission line was detected in UV band. It appears close to 1216 A, so it was not moving fast at the moment of electron capture.
This line detection has nothing to do with a galaxy's velocity or distance.
Images 3, 4, 5)
There are candidate absorption and emission lines in the optical wavelength band. Some of the Balmer series lines are in this range. If any of them are shifted, these atoms are in the line of sight and indicate nothing of the galaxy.
Images 6-12)
There is nothing if interest for a galaxy in these mid-infrared wavelengths.
Images 13-24)
These are spectrum captures of the galactic nucleus.
The nucleus of the Sombrero Galaxy is classified as a low-ionization nuclear emission-line region (LINER).
A LINER galaxy is characterized by metallic emission lines in the line of sight to the nucleus.
These spectra of various elements (there are several for different elements) are worthless, when trying to measure a galaxy's velocity. These atoms are in motion within the nucleus. It is a mistake to assume any motion they might have, in this narrow region, is at all related to the much larger, entire galaxy.
There is no spectrum provided for these plots of velocities. The only possible origin of this plot is several emission lines around 21 cm. Each line had its wavelength measured from 21 cm. The difference was compared to 21 cm where diff / 21 cm = z. Next, each z was multiplied by c, resulting in a series of velocity with wavelength intensity as shown.
Image 25 might be the origin of the claimed velocity of 1024.
The first peak is around 1000 while the second could be around 1024.
Taking one peak out of a distribution is not a suitable measurement technique. In this case, the selected value must have a defined margin of error to address the inherent uncertainty in the mix when using this method.
If the student had been given this spectrum in place of the one in the exercise, they would have confronted the clear ambiguity when using the neutral hydrogen emission line.
Perhaps the exercise was just for the calculations, not to learn how the velocity is extracted from a measurement, like an astronomer must do.
It is impossible for this set of atoms in the line of sight, having differences in their 21 cm emission line to indicate the galaxy's proper velocity.
None of these peaks can be the galaxy's velocity in any direction. Using them is a mistake.
It is impossible to measure any 3-dimensional proper velocity when using only the line of sight.
11.4 Negative velocity
There at least 20 galaxies having a negative relative velocity in the data set.
These are unusual because in most cases, the atoms are moving toward the galaxy by gravity, not away.
The 2 close spiral galaxies in our Local Group are M31 and M33. As noted in Section Galaxies, their negative velocity comes from the calcium ion absorption lines, which arise in the line of sight, not the galaxy. The optical spectra from both were provided.
It is a mistake to measure a shift of an absorption or emission line in a galaxy spectrum, and then use that shift from an atom as a velocity for the galaxy.
From the Data Set, these are the other galaxies having a negative velocity:
Segue 2 dwarf, Ursa Minor dwarf, Pisces dwarf,
IC 10, IC 1613, Maffei 2, WLM,
NGC 147, 185, 221, 404, 598, 3031, 4192, 4569, 6166, 6822.
The following 2 statements are not in the book.
Astronomers assume if any measurement is called a redshift, then it can be used with Hubble's constant to get a distance.
Unfortunately, that assumption is wrong.
Go to Table of Contents, to read a specific section.
;ast update: 01/14/2022