Cosmology View
My views on Cosmology and Physics
site navigation menu
Book by David Michalets
This is section 9 of 18.
The web page series for Distant Spectral Shifts is based on my book Cosmology Crisis Cleared.
Much of this section 9 is new, not in the book. The book concentrated on galaxies.
Quasar is short for quasi-stellar object. They are faint in visual wavelengths, by dimming from clouds of ions, but intense in a wide range of wavelengths from X-ray to radio.
A quasar is misunderstood in modern cosmology.
My model for a quasar was presented in my book Cosmology Transition, but its details are not relevant to this book about redshifts. The same rule for a galaxy redshift applies to a quasar.
Neither has a physical surface, like a photosphere on a star for attaching an atom. Therefore, no atoms can move with the quasar. All absorption lines (quasars exhibit none) and all emission lines exhibit nothing about a quasar's motion.
The spectrum of a quasar has many emission lines. Arp did not do an analysis of a quasar's redshift mechanism, but I did. His book offered 2 annotated spectrograms.
Unknown to Arp, a quasar actually has 2 measurable red shifts:
1) Hydrogen Lyman-alpha emission line; this occurs when a proton captures an electron; the change in the new hydrogen atom's energy state is radiated away in this wavelength; the velocity or kinetic energy of the proton at that instant results in a redshift of that wavelength.
This emission line is found in a typical quasar and is its primary red shift measurement. There are quasars with this line red shifted indicating a proton velocity more than 6 times the velocity of light, when the quasar z is greater than 6.
2) Emission lines from a number of metallic ions, where metallic means not hydrogen or helium.
These emission lines occur when an ion captures an electron; the change in the ion's energy state is radiated away in this wavelength; the ion's velocity, relative to the velocity of light at that instant, results in a red shift of that characteristic wavelength. All the ions share the same red shift because all are moving by the electrical charge differential with the plasmoid in the quasar's core.
The variety of metallic ions can vary among quasars from different Seyferts.
A Seyfert galaxy is in a galaxy class called LINER, for
Low-Ionization Nuclear Emission Region. This means there are many metallic ions in the core region of the galaxy. When an ion captures an electron, an emission line occurs.
When a Seyfert ejects a plasmoid from its core, the plasmoid is accompanied by the mix of metal ions in this particular Seyfert. The ejection mechanism is not relevant to this book.
The Seyfert provides the ions which are observed by the second red shift.
The set of quasars used by Halton Arp are described below.
9.1 Plasmoid in Quasar
A plasmoid is a torus-shaped plasma entity having an electrical current bound by its magnetic field. A plasmoid was famously imaged in April 2019 in the core of M87 galaxy.
The plasmoid and the M87 jets were explained in a YouTube video titled: "Wal Thornhill: Black Hole or Plasmoid?" [Reference:
https://www.youtube.com/watch?v=J4NffTr_GMk ]
9.2 Mechanism for a superluminal proton.
The video referenced above described how the plasmoid in M87 emits jets having a high velocity.
With FD meaning duration of force
From basic physics, F = ma
V=a * FD
Therefore, a sustained force will achieve a velocity based on mass and duration.
A plasmoid is an electric current bound by the magnetic field being generated, so it is an electrical ring. In the center of that ring is a magnetic field, as well as on the outside of the ring. A positively charged proton moving through the center of the ring is subject to the Lorentz force which acts at a perpendicular angle, so the proton is accelerated by this force and its final velocity depends on the duration of its presence in the field and on its strength.
Einstein had a wrong assumption that mass has a velocity limit at c. That is a mistake shown by a typical quasar.
Note:
Einstein's wrong assumption has interesting consequences.
When a force is sustained, then the energy is being transferred to kinetic energy in the mass. If the mass does not increase its velocity, then either the energy must be transferred to another object, or it is lost which is a violation of thermodynamics and the conservation of energy. Einstein was wrong.
9.3 Lyman-alpha forest
This is a feature found in the spectrum of many quasars.
In astronomical spectroscopy, the Lyman-alpha forest is a series of absorption lines in the spectra of distant galaxies and quasars arising from the Lyman-alpha electron transition of the neutral hydrogen atom. As the light travels through multiple gas clouds with different redshifts, multiple absorption lines are formed. [Reference:
https://en.wikipedia.org/wiki/Lyman-alpha_forest ]
Observation:
This behavior is in some of the examples to follow.
9.3 Typical Quasar
For an immediate reference for a quasar spectrum, here is a figure from a Caltech web article describing a typical quasar spectrum. [Reference:
Its title is "Quasistellar Objects: Intervening Absorption Lines"
http://ned.ipac.caltech.edu/level5/Charlton/Charlton1_1.html
]
click on link to view Figure 1.
https://www.cosmologyview.com/NEDcap/QSO-spectra/CalTech-figure1.png
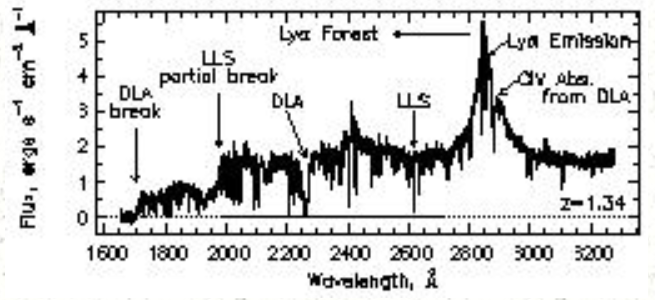
The spectrum in the figure shows the measured wavelength of redshifted "Lya Emission" from the "z=1.34"
This "typical quasar" is superluminal, with z >1.
However, this redshift velocity is of the proton, not the quasar.
The caption has "quasar continuum and emission lines" where "continuum" is its synchrotron radiation from its AGN, which is a plasmoid, and the spectrogram shows many emission lines from metallic ions capturing ions.
The caption finishes with the "quasar's Lya emission line, separate from the rest.
The Lyman-alpha emitter description in the section Galaxies implied this emission line occurs under extreme conditions, while here a typical quasar will exhibit this line. Typical is not extreme.
The comparison suggests the Wikipedia LAE galaxy description excerpted in section Galaxies was written when unaware of typical quasars.
The very important conclusion with quasars is their red shift always comes from emission lines, which always come from either an ion or proton capturing an electron. Emission lines offer no information, like velocity, of any object behind them in the line of sight.
9.4 3C 48
3C48 is a quasar discovered in 1960; it was the second source conclusively identified as such.
3C48 was the first source in the Third Cambridge Catalogue of Radio Sources for which an optical identification was found by Allan Sandage and Thomas A. Matthews in 1960 through interferometry. Jesse L. Greenstein and Thomas Matthews found that it had a redshift of 0.367, making it one of the highest redshift sources then known. It was not until 1982 that the surrounding faint galactic "nebulosity" was confirmed to have the same redshift as 3C48, cementing its identification as an object in a distant galaxy. This was also the first solid identification of a quasar with a surrounding galaxy at the same redshift.
[Reference:
https://en.wikipedia.org/wiki/3C_48
]
Observation:
The story does not identify the name of the galaxy having the same redshift as this quasar. Therefore, it is impossible to look for its data in NED.
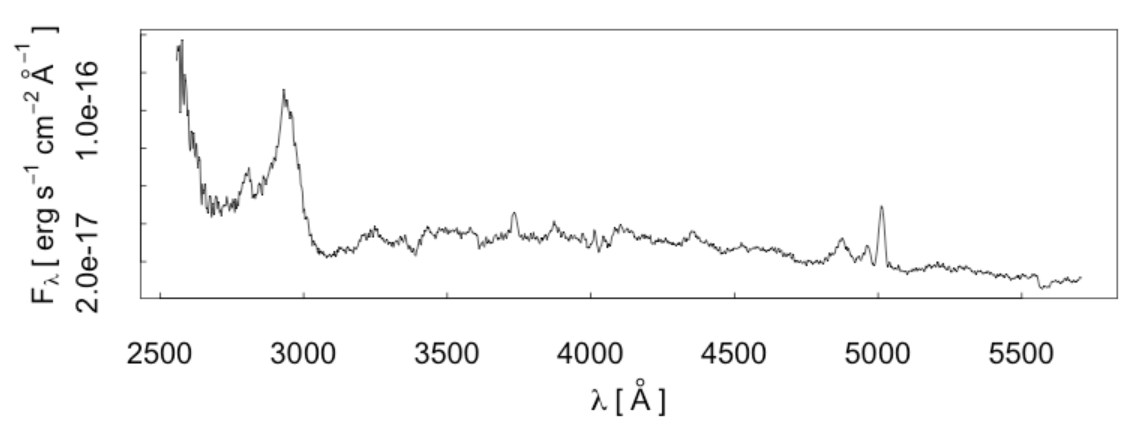
Here is 3C 48 spectrum in optical band.
https://www.cosmologyview.com/NEDcap/QSO-spectra/NED-3C48-1-OPT.png
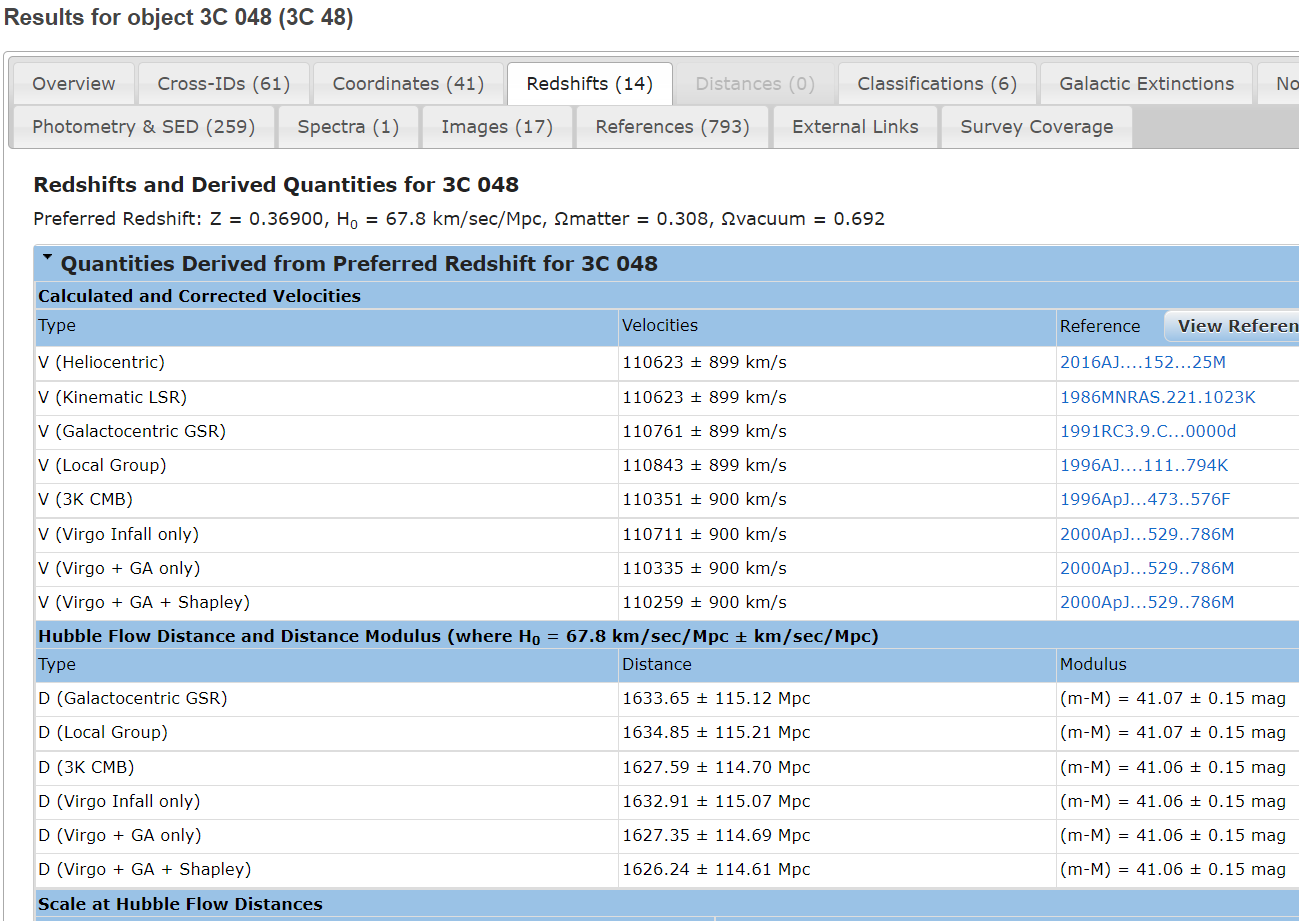
Here are 3C 48 redshift velocities shown in NED.
https://www.cosmologyview.com/NEDcap/QSO-spectra/NED-3C48-2-redshifts.png
NED never identifies the spectral origin of the z value.
NED has Z = 0.84989.
This is 85% the velocity of light.
The optical band has a narrow absorption line near 3900A.
The optical band has a wide emission line near 5000A.
Perhaps, one of the 2 lines has the high redshift.
An accurate calculation of z requires the measured wavelength, which is not provided.
NED Redshifts page shows a margin of error for each velocity and distance, but no data to justify the values.
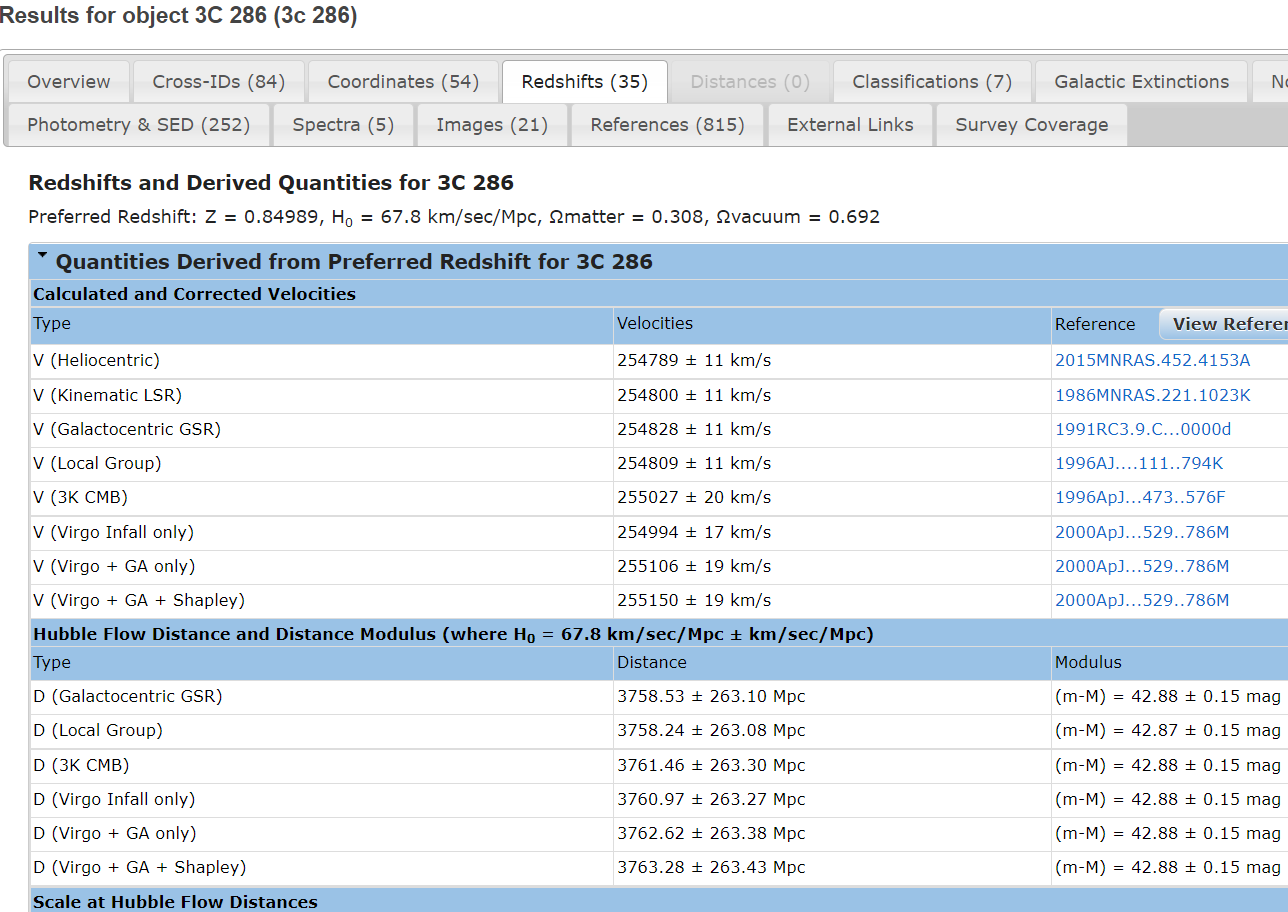
9.5 3C 286
3C 286, also known by its position as 1328+307 (B1950 coordinates) or 1331+305 (J2000 coordinates), is a quasar at redshift 0.8493 with a radial velocity of 164,137 km/s. It is part of the Third Cambridge Catalogue of Radio Sources (3C Survey).
The 3C Survey was conducted at the relatively low radio frequencies of 159 and 178 MHz. The total power measurements were made with an instrument that produced a 4.6 degree by 13.6 arc minute fan-beam, and interferometric measurements were made with a synthesized beam width of about 7.5 arc minutes. Those beams were too broad to produce coordinates precise enough to allow the radio source to be matched with a corresponding faint optical counterpart. In 1962, 3C 286 was observed with the higher frequency two-element interferometer at Owens Valley Radio Observatory, which produced improved source coordinates with a precision of ~10 arc seconds. With the new coordinates, observations at the Palomar Observatory allowed the optical counterpart to be unambiguously identified: a magnitude 17.25 object with a star-like appearance. Because of this early identification of an optical counterpart, 3C 286 was one of the objects described in the paper where the term quaser was first used.
The radio wave spectral flux density of 3C 286, from 10 MHz to 230 GHz. Plotted from data presented in An et al., 2017.
3C 286 is a Compact Steep Spectrum (CSS) source, which means that its size is less than 15 kiloparsecs (13.7 in the case of 3C 286), and the observed spectral flux density is proportional to να, where ν is the frequency and α ≤ -0.5 (in the case of 3C 286 α ≈ -0.61). CSS sources may be relatively young, with jets that are still expanding. While CSS sources represent a large fraction of the radio galaxies found in flux limited surveys, 3C 286 is one of only two CSS sources whose γ-rays were detected by Fermi-LAT.
High resolution images made at 8.4 GHz with the Very Large Array show that 3C 286 has a jet about 2.6 arc seconds long extending west-south-west from the core, and a counter jet extending 0.8 arc seconds east from the core. Emission from the jet to the west-south-west is highly polarized, with E-vectors parallel to the jet axis.
[Reference:
https://en.wikipedia.org/wiki/3C_286
]
Observation:
The jets from this quasar's plasmoid are like the jets from the plasmoid in the M87 elliptical galaxy.
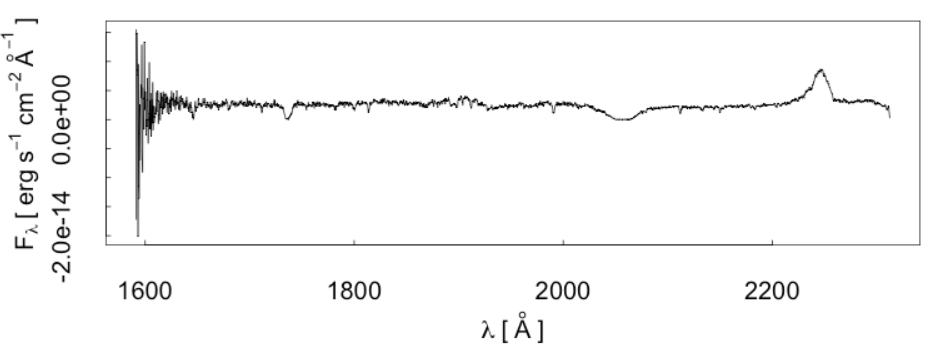
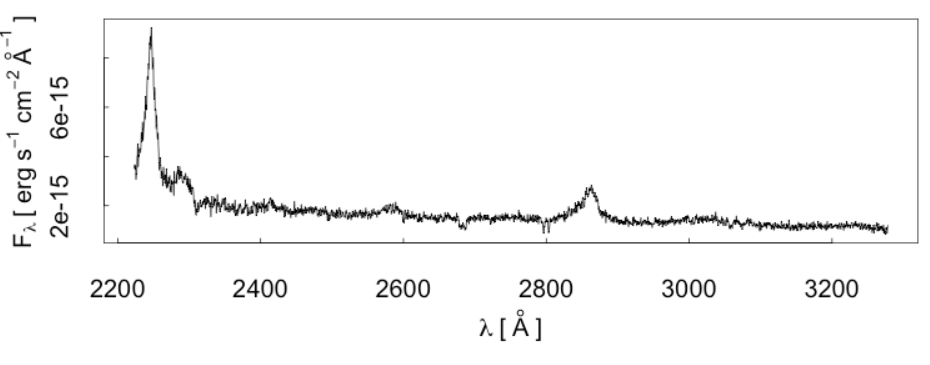
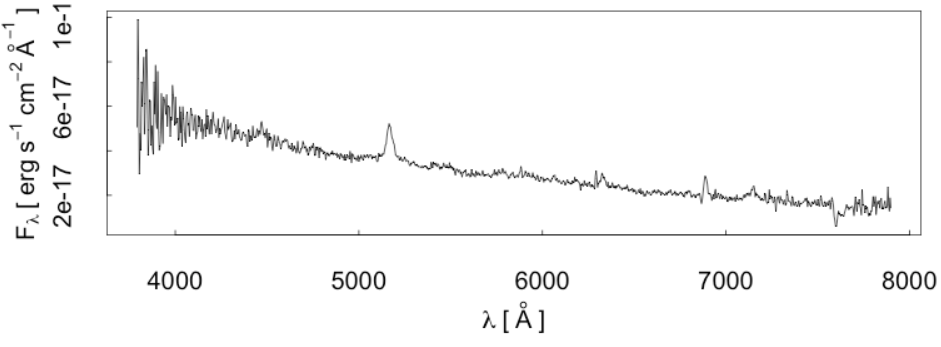
9.5.1 3C 286 Spectra
There are several spectra.
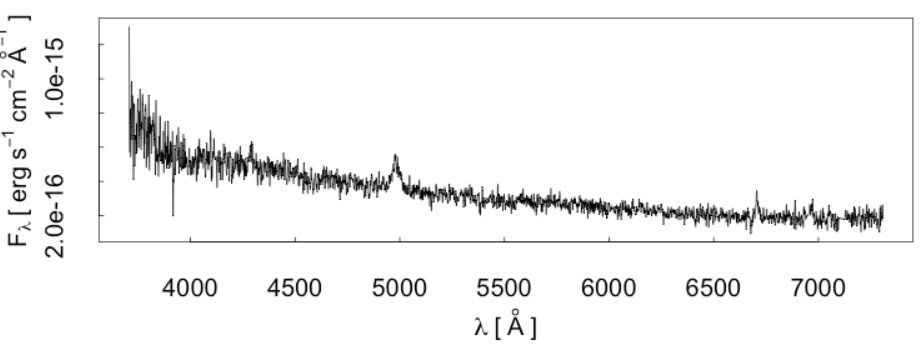
Here is the optical band
https://www.cosmologyview.com/NEDcap/QSO-spectra/NED-3C286-1-OPT.png
Here is the 1st Lyman-alpha forest
https://www.cosmologyview.com/NEDcap/QSO-spectra/NED-3C286-2-LaF.png
Here is the 2nd Lyman-alpha forest
https://www.cosmologyview.com/NEDcap/QSO-spectra/NED-3C286-3-LaF.png
Here is the Mg II line.
https://www.cosmologyview.com/NEDcap/QSO-spectra/NED-3C286-4-MgII.png
Here is the 3C 286 Redshifts page in NED.
https://www.cosmologyview.com/NEDcap/QSO-spectra/NED-3C286-5-redshifts.png
NED never identifies which spectral line resulted in a stated redshift velocity.
9.6 Halton Arp's Quasars
Halton Arp's book Seeing Red concentrated on quasars and their apparent quantized red shifts.
[Reference:
book: Halton Arp's book Seeing Red
Publisher: Apeiron; June 1, 1997
Wikipedia description of NGC 4258.
https://en.wikipedia.org/wiki/Messier_106
]
Observation:
The quasars mentioned in the book are low redshift quasars. Most of thosde mentioned are z < 1. Mistakes arise when using a poor sample of the object being studied.
A Caltech study in 2000 had a "typical spectrum for a quasar" with z=1.34.
Its title is "Quasistellar Objects: Intervening Absorption Lines"
[Reference: Its link is above, in Lyman-alpha forest.
This "typical quasar" has an important difference than the NGC 4258 quasars in Figure 1-2 in Arp's book. This should be obvious in the 2 figures linked in this section.
Arp frequently mentions quasars and BL Lac objects in his book.
Arp describes a BL Lac spectrum as one that washed out the hydrogen emission line which is observed with a quasa. Others concluded the BL Lac object simply has no emission lines. The distinction is important because the emission line, when present, is not directly connected to the AGN. Arp seems to treat BL Lac objects as a completely different class though they are nearly the same.
A 2002 study by BeppoSAX of both types, QSO and BLLac, concluded their AGN was a source of synchrotron radiation, which means, though not stated, both types are a plasmoid.
The study concluded that was the radiation from the AGN, not its opposite which is thermal radiation, which would come from a hot accretion disk around a black hole. Therefore, by this study, these objects have no black hole for their AGN.
A plasmoid generates a flat spectrum so any absorption or emission lines are from atoms in the line of sight. This was also the conclusion of the Caltech quasar study.
excerpt from that Caltech paper:
The relatively flat quasar continuum and broad emission features are produced by the quasar itself. In some cases, gas near the quasar central engine also produces "intrinsic" absorption lines, most notably Lyalpha, and relatively high ionization metal transitions such as C IV, N V, and O VI. These intrinsic absorption lines can be broad [thousands or even tens of thousands of km/s in which case the quasar is called a broad absorption line (BAL) QSO], or narrow (tens to hundreds of km/s). However, the vast majority of absorption lines in a typical quasar spectrum are "intervening'', produced by gas unrelated to the quasar that is located along the line of sight between the quasar and the Earth.
(excerpt end)
observation:
The quasar study does not assign the red shift velocities of lines from gas atoms to the quasar. These velocities of atoms can reach thousands of km/s.
The study's Figure 1 shows a prominent Hydrogen Lyman-alpha emission line red shifted. This atom in motion is not the same as the quasar.
The speed of light is 300,000 km/s so clearly it is a drastic mistake to assign any of these measured velocities of atoms to the quasar.
The phrase "tens of thousands" could be close to the speed of light.
Figure 1 in the quasar study has z=1.34 as "typical" which is 402,000 km/s.
Few quasars are z > 6. In Arp's book, the highest red shift is z < 3. Many are z < 1.
The crucial reminder for the Doppler effect:
Only a star has a photosphere surface, so only a star can have its line of sight velocity indicated by absorption or emission lines.
For a quasar, all absorption or emission lines indicate motion of atoms in the line of sight. The velocity of a quasar cannot be measured in its spectrum.
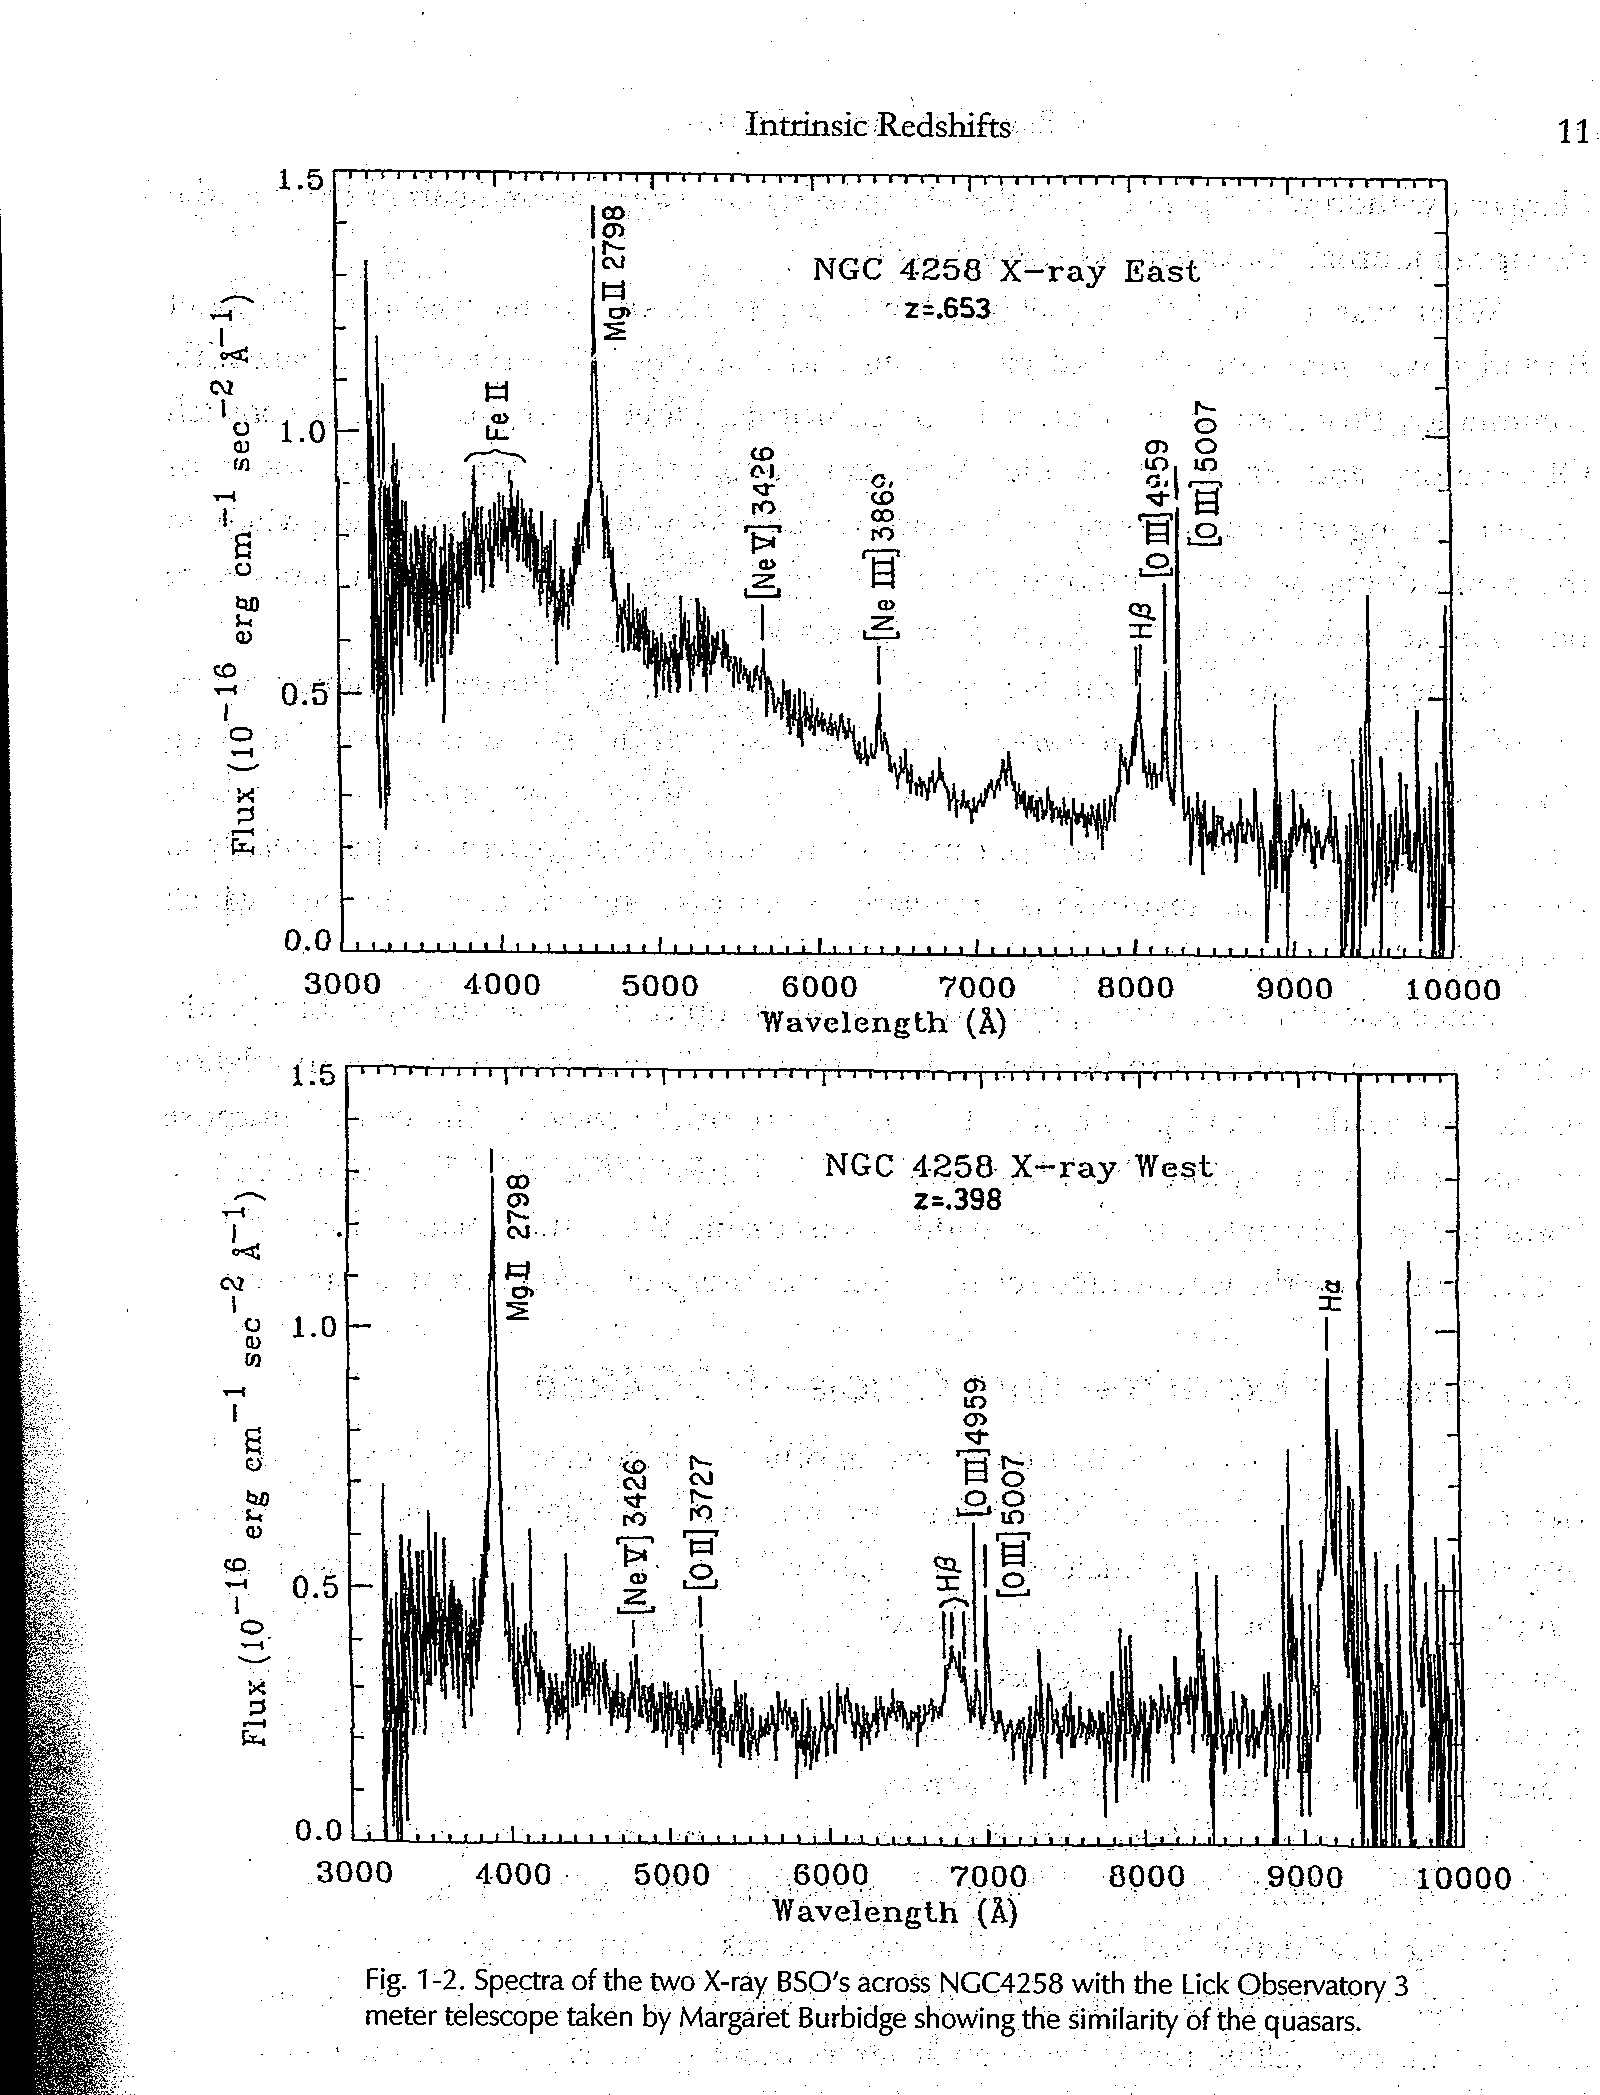
Here is page 11 from Arp's book and Figure 1-2.
https://www.cosmologyview.com/NEDcap/QSO-spectra/arp-figure1-2.png
The spectrum from NGC 4258 (or M106) is shown. This is a couble lobed radio galaxy so the two spectra are for the "East" and "West" lobes which are considered by Arp to be 2 quasars..
Each spectrum identifies specific emission lines and their emitted wavelength.
It is clear how the z value in the figure was calculated for each lobe.
from East lobe:
Mg II line emitted at 2798 Angstroms is observed at 4625 for z=0.653
Neon III line at 3869 Angstroms is at 6395 for z=0.653
H beta line at 4861 Angstroms is at 8053 for z=0.653
O III line at 5007 is at 8280 for z=0.653
from West lobe:
Mg II line at 2798 Angstroms is at 3911 for z=0.398
H beta line at 4860 Angstroms is at 6795 for z=0.398
O III line at 5007 is at 7000 for z=0.398
All these atoms appear to have the same velocity toward the plasmoid.
The above velocities are consistent until the far right:
H alpha line at 1216 Angstroms is at 9100 for z=6.5
The East lobe had no H alpha line indicated but I suspect it is that peak near the right side with no element identified.
If it is then:
H alpha line at 1216 Angstroms is at 9300 for z=6.65
Both lobes indicate a similar quasar redshift z > 6 when using the hydrogen lyman-alpha emission line consistent with "typical" quasars.
All these emission lines are from atoms in motion separate from the plasmoid inside the quasar.
Arp's book assumes these lobes are z= 0.653 and 0.398 but these values are lower than others could conclude when checking the longest wavelengths, where the hydrogen emission lines are found when having a high redshift..
Perhaps, this should be repeated.
Both of these spectra have a second, higher, redshift, than the book uses.
For a comparison, both Arp and Caltech spectra (earlier in this section) are provided in this section.
A typical quasar has a prominent hydrogen emission line which is red shifted, known since 1963.
The puzzle was solved by the Dutch American astronomer Maarten Schmidt, who in 1963 recognized that the pattern of emission lines in 3C 273, the brightest known quasar, could be understood as coming from hydrogen atoms that had a redshift (i.e., had their emission lines shifted toward longer, redder wavelengths by the expansion of the universe) of 0.158. In other words, the wavelength of each line was 1.158 times longer than the wavelength measured in the laboratory, where the source is at rest with respect to the observer. At a redshift of this magnitude, 3C 273 was placed by Hubble's law at a distance of slightly more than two billion light-years. This was a large, though not unprecedented, distance (bright clusters of galaxies had been identified at similar distances), but 3C 273 is about 100 times more luminous than the brightest individual galaxies in those clusters, and nothing so bright had been seen so far away.
[Reference:
https://www.britannica.com/science/quasar ]
Observation:
The description is misleading because only one emission line is red shifted, the Hydrogen lyman-alpha line at 1216 Angstroms. This is the line used in a "typical" quasar for Caltech. The description implies many lines shifted the same but that interpretation is wrong.
Conclusion: Arp was probably misdirected by the apparent low red shift quasars in the sample.
If the NGC 4258 quasars have wrong red shifts (the "featured" spectra) then the others in the sample probably do too.
I suspect the reason why the atom emission lines show a similar velocity for each quasar is these are ionized atoms so as plasma they would be moving together.
The electric force is between charges, so the same charge gets the same force. The mass of the participants is not in the equation.
Here is a link to the spectrogram of Arp's quasars
https://www.cosmologyview.com/pdfs/arp-figure1-2.png
9.7 BL Lacertae
BL Lac objects are mentioned in Halton Arp's book seeing Red. These objects were sometimes associated with the set of a Seyfert and 1 or more quasars.
The difference between them is obvious in their spectra.
Here is the object which defined this type of celestial object.
https://en.wikipedia.org/wiki/BL_Lacertae
From NED Redshifts(46)
https://www.cosmologyview.com/NEDcap/QSO-spectra/BLLAC-redshifts.png
From Spectra(2)
Image 1, Optical band
https://www.cosmologyview.com/NEDcap/QSO-spectra/BLLAC-OPT-1.png
Image 2, Hydrogen-beta line
https://www.cosmologyview.com/NEDcap/QSO-spectra/BLLAC-HB-line.png
NED H-Beta line panel claims a shift of H-B line from 487.5 A to 489.9 A
The optical spectrogram shows no line near those wavelengths..
Observation:
There comparison between quaasar and a BL Lac object is both are a plasmoid emitting synchrotron radiation. This is seen as energy distributed across the wavelength band from UV to infrared.
Quasars usually have metallic ion emission lines. Some have the Lyman-alpha forest ofabsorption lines.
There is only 1 emission line in the optical spectrogram, at the far rightl, or in infrared. Since most emission lines are not in that band, this line has a significant redshift. This atom is moving away and fast, but not BL Lacertae.
The single emission line comes from an atom having only 1 electron dropping tp ground state.
Astronomers chose Hydrogen-beta rather than Lyman-alpha. This selection determines the z value for that single emission line.
If Lyman-alpha had been selected, then this z would be much greater.
Observation:
A BL Lac object is a plasmoid having no cloud of metallic ions (seen in both the Caltech typical quasar and in Arp's M106.
Since it exhibits no Lyman-alpha forest, it has no cloud of hydrogen atoms seen in the Cattech typical quasar.
9.8 Quasar Sumary
Every quasar has its velocity from measuring spectral lines from atoms in the line of sight.
Each velocity measured this way is wrong and must be ignored.
A distance based on the wrong velocity is also wrong and must be ignored.
Go to Table of Contents, to read a specific section.
;ast update: 01/14/2022